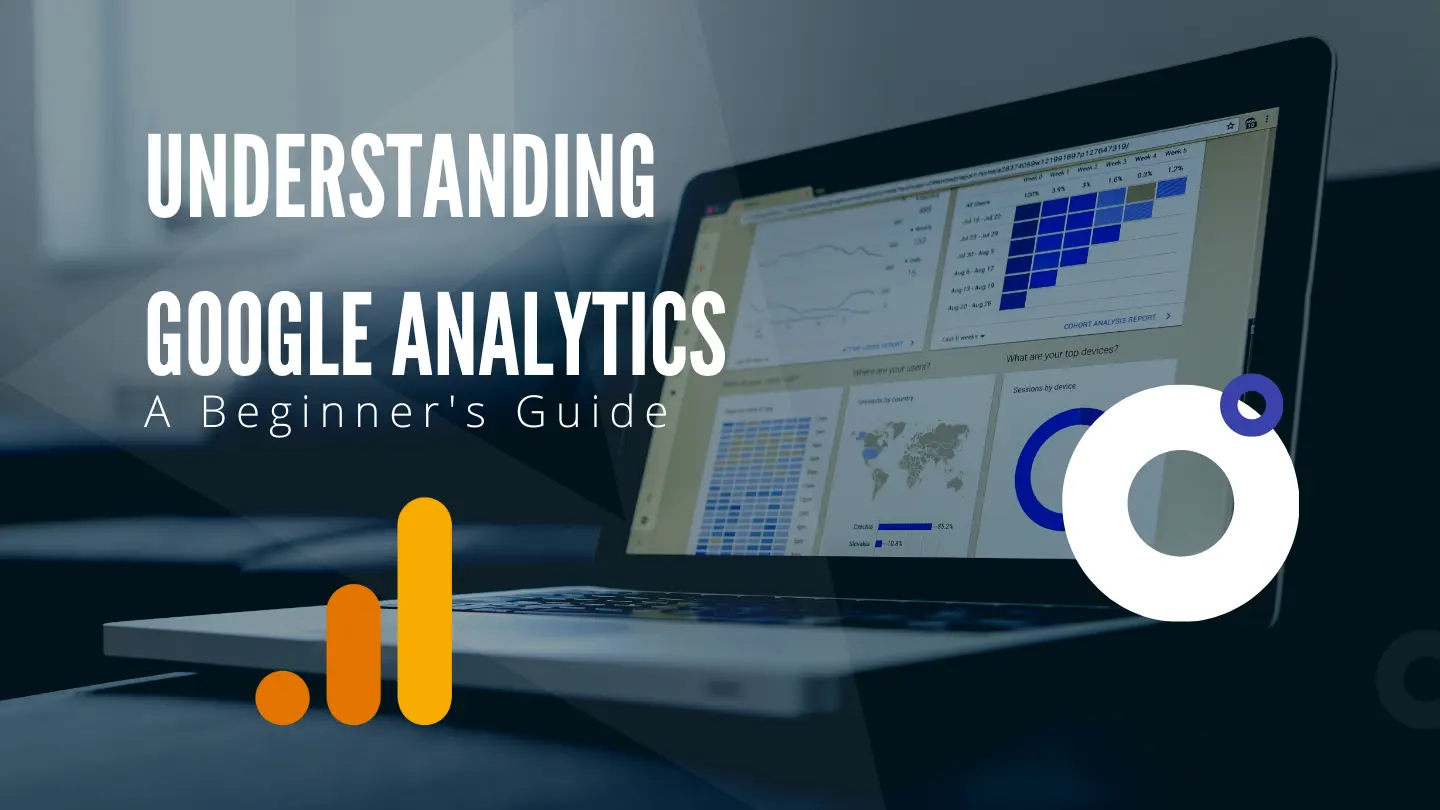
Google Analytics is like having a personal spy for your website. It’s the ultimate tool for understanding how visitors interact with your site. Businesses that want to stay ahead of the game use Google Analytics to track their website performance. This powerful platform gives you insights into what’s working and what’s not, so you can make informed decisions to boost your online presence.
By delving into the Google Analytics interface, you can uncover valuable data on user behavior, traffic sources, and conversions. With features like Google Tag Manager and Universal Analytics, you’ll gain a deeper understanding of how users click through your site. So, if you’re ready to take charge of your online success, buckle up, and let’s dive into the world of Google Analytics.
Table of Contents
ToggleSetting Up Google Analytics
Step-by-Step Guide to Setting Up Google Analytics
Setting up Google Analytics is essential for tracking and analyzing website traffic. To begin, navigate to the Google Analytics website and sign in using your Google email ID. Once signed in, you can create a new Google Analytics account or use an existing one.
Creating an Account and Property in Google Analytics
After signing in, click on “Admin” at the bottom left corner of the page. Then, under the “Account” column, select “Create Account.” Next, fill out the required information such as the account name, website name, URL, industry category, and reporting time zone. After creating the account, proceed to set up a property within that account by clicking on “Create Property.” Here, enter your website’s information including its name and URL.
Installing the Tracking Code on Your Website
Upon setting up the property, you will be provided with a unique tracking ID and code snippet. Copy this tracking code snippet and paste it into every web page that you want to track within your website. Alternatively, if you are using Google Tag Manager for managing tags on your website, you can also add the tracking code through this platform.
By following these steps diligently while setting up Google Analytics for your website or online platform, you ensure that accurate data is collected for analysis.
Remember that understanding how users interact with your site is crucial for making informed decisions about its performance and user experience. By leveraging Google Analytics effectively from its setup stage onwards, you lay a solid foundation for gaining valuable insights into visitor behavior.
Basics of Google Analytics
Navigating the Google Analytics Dashboard
When you log into your Google Analytics account, the dashboard is where you’ll find a comprehensive overview of your website’s performance. It provides quick access to essential reports and data, allowing you to track and analyze various metrics.
Navigating through the dashboard, you will come across different sections such as real-time, audience, acquisition, behavior, and conversions. Each section offers valuable insights into specific aspects of your website’s performance.
Understanding Key Metrics like Sessions, Users, and Pageviews
Sessions refer to the interactions users have on your website within a specific timeframe. It includes all activities performed by a user during their visit. This metric helps in understanding how engaged visitors are with the content on your site.
Users represent unique individuals who visit your website. It’s important to differentiate between users and sessions as one user can have multiple sessions.
Pageviews indicate the total number of pages viewed by visitors on your website. This metric gives an insight into which pages are most popular among users and helps in identifying areas for improvement.
Overview of Audience, Acquisition, Behavior, and Conversion Reports
The Audience report provides detailed information about the characteristics of your website visitors. It includes demographics such as age, gender, location, and interests. This data is vital for tailoring content to better suit the preferences of your audience.
The Acquisition report reveals how visitors find your website. Whether it’s through organic search results, social media platforms or referral links from other websites – this report helps in understanding which channels are driving traffic to your site.
The Behavior report delves into how users interact with your website’s content. It showcases metrics like top-performing pages, average time spent on each page, bounce rate (percentage of single-page visits), and more.
The Conversion report is crucial for tracking specific actions taken by users that align with your business goals – whether it’s making a purchase or signing up for a newsletter. Understanding these conversion metrics allows you to optimize your website for improved performance.
Google Analytics Mechanisms and Reports
The mechanisms and reports in Google Analytics provide valuable insights into website performance. Let’s delve into the real-time reporting, standard and custom reports, and the use of data visualization tools for effective analysis.
Exploring Real-Time Reporting
Real-time reporting in Google Analytics offers a live view of visitor activity on a website. It provides immediate feedback on how users are interacting with the site at that moment. For instance, it can reveal the number of active users, their geographic locations, the pages they are viewing, and even conversion events as they occur. This feature enables website owners to monitor campaigns, events, or content launches in real time to assess their impact.
Overview of Standard and Custom Reports Available
Google Analytics offers both standard and custom reports to analyze various aspects of website performance. Standard reports provide pre-built templates for analyzing data such as audience demographics, acquisition sources, behavior flow, and conversion rates. On the other hand, custom reports allow users to tailor their analysis by selecting specific metrics and dimensions that align with their unique business goals. These customizable reports offer a deeper understanding of user behavior patterns tailored to individual preferences.
Utilizing Data Visualization Tools for Easy Analysis
Data visualization tools within Google Analytics simplify complex data sets into easy-to-understand visual representations. These tools include graphs, charts, heat maps, and more. By presenting analytics data visually rather than numerically or textually, these tools make it easier for users to identify trends, correlations, and outliers within the data. For example, a line graph can visually represent changes in website traffic over time while a heatmap can illustrate areas of high user engagement on a webpage.
Tracking and Analyzing Visitors
Tracking User Demographics and Interests in Google Analytics
Google Analytics allows tracking user demographics such as age, gender, location, and interests. This data provides valuable insights into the target audience, enabling businesses to tailor their content and marketing strategies to better resonate with their visitors. For instance, if a website’s primary demographic is young adults interested in technology, the content can be optimized to cater more specifically to this group.
Analyzing Visitor Flow and Behavior on the Website
Analyzing visitor flow involves understanding how users navigate through a website. Google Analytics offers visual representations of user behavior, enabling businesses to identify popular pages and potential bottlenecks in the user journey. By examining which pages users visit most frequently or where they drop off, businesses can optimize their website’s structure and content for improved user experience. For example, if a significant number of visitors leave the site after viewing a particular page, it may indicate that the content or call-to-action on that page needs improvement.
Understanding Bounce Rate and Its Impact on User Experience
Bounce rate refers to the percentage of single-page sessions where visitors leave a website without interacting further. A high bounce rate could signify various issues such as slow loading times, irrelevant content, or poor navigation. By analyzing bounce rates for different pages, businesses can pinpoint areas for improvement. For instance, if a landing page has a high bounce rate, it might indicate that the page does not effectively engage visitors or fulfill their expectations.
Understanding these aspects of Google Analytics empowers marketers to make informed decisions based on data accuracy rather than assumptions or guesswork. Custom reports within Google Analytics offer tailored insights by allowing users to focus on specific metrics aligned with their business objectives.
By utilizing funnel visualization in Google Analytics, marketers gain visibility into how many users complete specific actions or goals on their websites. This information helps in identifying points where visitors drop off before completing desired actions such as making a purchase or signing up for a newsletter.
Analyzing traffic sources within Google Analytics reveals where site traffic originates from – whether it’s organic search results, social media platforms, referral links from other websites or paid advertising campaigns. Understanding these sources enables businesses to allocate resources effectively by investing more in channels driving significant traffic while optimizing underperforming ones.
Understanding User Behavior and Acquisition
Analyzing User Engagement Through Behavior Flow Reports
Understanding user behavior data is crucial for optimizing the user experience on a website. Google Analytics provides behavior flow reports that visually represent the path users take through a site, showing where they enter and exit, as well as the pages they visit in between. By analyzing this data, businesses can identify popular content, potential bottlenecks in the user journey, and areas for improvement. For example, if a significant number of users drop off after visiting a specific page, it may indicate issues with that particular page’s content or functionality.
Behavior flow reports also reveal how users navigate through different sections of a website. This insight helps businesses tailor their content to better meet user expectations and preferences. For instance, if users frequently move from one specific page to another, it signals an interest in the linked content or products. Consequently, companies can use this information to optimize their website layout and enhance user engagement.
Understanding the Sources of Traffic Through Acquisition Reports
Acquisition reports in Google Analytics provide valuable insights into where website traffic originates. These reports categorize traffic sources into various channels such as organic search, direct traffic, referral traffic, social media, and paid advertising. By understanding which channels are driving the most traffic to their site, businesses can allocate resources effectively to maximize their online presence.
For example, if an e-commerce website observes that a substantial portion of its traffic comes from social media platforms like Instagram or Facebook, it may consider investing more in social media marketing strategies to further boost acquisition from these channels. Conversely, if organic search contributes significantly to overall traffic volume but has low conversion rates compared to other channels like referral or direct traffic, efforts can be directed towards improving SEO or refining landing pages for organic search visitors.
Utilizing Event Tracking to Monitor Specific User Interactions
Event tracking enables businesses to monitor specific interactions on their websites such as clicks on buttons, downloads of files or documents, video views, form submissions, and more. By setting up event tracking in Google Analytics, companies gain deeper insights into how users engage with their site beyond page views and session durations.
For instance: A company offering software downloads can track the number of times users initiate downloads; this data helps them gauge interest in their product offerings and refine their marketing strategies accordingly. Similarly: An e-commerce platform utilizing event tracking might monitor add-to-cart actions or clicks on promotional banners to evaluate the effectiveness of different sales tactics.
Google Analytics 4 (GA4) Introduction
Google Analytics 4 (GA4) is the latest iteration of Google’s analytics platform, designed to offer a more advanced and comprehensive approach to tracking and analyzing user data. It provides businesses with enhanced insights into customer behavior across various platforms, including websites, apps, and other digital channels. GA4 introduces a more user-centric model that focuses on individual user interactions, allowing businesses to gain a deeper understanding of their audience.
Key Differences Between Universal Analytics and GA4
One of the key differences between Universal Analytics and GA4 is the shift from session-based data collection to an event-driven model. In Universal Analytics, data was primarily organized around sessions and pageviews, whereas GA4 emphasizes events as the primary data collection method. This shift enables a more holistic view of user interactions beyond traditional web pages, encompassing actions such as scrolling, video views, file downloads, and more. GA4 incorporates machine learning capabilities for predictive metrics and cross-device tracking by default, providing a more comprehensive view of user journeys.
Benefits of Upgrading to GA4 for Advanced Analytics Capabilities
Upgrading to GA4 offers several significant benefits for businesses seeking advanced analytics capabilities. Firstly, GA4 provides improved integration with Google Ads and additional cross-platform tracking features that enable businesses to understand the complete customer journey across multiple touchpoints. Moreover, it offers enhanced reporting capabilities that leverage machine learning algorithms for predictive insights into customer behavior and lifetime value prediction.
Furthermore, GA4 introduces a more streamlined approach to data management through its event-driven data model. This allows businesses to capture detailed event data without extensive customization efforts while also facilitating enhanced analysis of user engagement across different devices and platforms seamlessly.
Goal Tracking and Site Content Analysis
Setting Up Goals
Setting up goals in Google Analytics allows you to track specific actions on your website that indicate user engagement or conversions. These could include reaching a particular page, submitting a form, or making a purchase. By defining these goals, you gain valuable insights into the effectiveness of your website in driving user actions. For instance, if your goal is to track newsletter sign-ups, setting up this goal enables you to monitor the number of visitors who successfully complete the sign-up process.
Analyzing Site Content Performance
Google Analytics provides behavior reports that offer comprehensive insights into how users interact with your site content. Through metrics like bounce rate, average time on page, and pages per session, you can assess the performance of different landing pages and understand which ones are resonating with your audience. This information helps in identifying high-performing content that attracts and retains visitors and also highlights areas for improvement.
Utilizing Site Search Tracking
Site search tracking in Google Analytics allows you to gain a deeper understanding of user intent by analyzing what visitors are searching for within your website. By examining the terms users are searching for, you can uncover valuable insights into their needs and preferences. For example, if an e-commerce website notices a significant volume of searches for “free shipping,” it may prompt them to consider offering free shipping promotions or prominently displaying existing offers related to shipping costs.
Understanding Google Analytics involves leveraging data collection tools such as smart goals and goal flow analysis at the property level. Smart goals utilize machine learning to identify visits most likely to lead to conversions based on signals like session duration and page views per session. This feature aids businesses in optimizing their conversion tracking without requiring manual configuration for each individual goal.
Analyzing the top pages report within Google Analytics provides essential data about which pages on your website attract the most traffic and engagement. By evaluating metrics such as unique page views, entrances, and bounce rate for each page, you can identify opportunities for enhancing underperforming areas while capitalizing on successful content strategies.
Utilizing goal path analysis enables visualizing the steps users take towards completing specific actions or conversions. This insight is invaluable in identifying potential bottlenecks or drop-off points within the conversion process and making informed optimizations to streamline user journeys.
SEO Integration and Performance Measurement
Integrating Google Analytics with Google Search Console for SEO Insights
Integrating Google Analytics with Google Search Console provides valuable insights into the website’s performance in organic search. By connecting these two powerful tools, website owners can gain a deeper understanding of how their site is performing in search engine results pages (SERPs). For instance, they can uncover which keywords are driving traffic to their site, identify the top-performing landing pages, and understand how users are interacting with their content.
Measuring Organic Search Performance through Landing Page Reports
Landing page reports in Google Analytics offer a comprehensive view of the website’s organic search performance. These reports provide essential metrics such as the number of sessions, bounce rate, and average session duration for each landing page. Website owners can use this data to identify high-performing landing pages that attract organic traffic and optimize underperforming ones to improve overall performance. Understanding which landing pages resonate most with organic visitors enables strategic decision-making for content optimization and user engagement enhancement.
Utilizing Campaign Tracking for Monitoring Marketing Efforts
Campaign tracking within Google Analytics allows website owners to monitor the effectiveness of their marketing campaigns across various channels. By adding unique UTM parameters to URLs used in different marketing initiatives, such as social media posts or email newsletters, businesses can track the performance of each campaign individually. This granular insight helps in measuring the impact of marketing efforts on website traffic and conversions. For example, it enables marketers to compare the success of different social media campaigns by analyzing metrics like conversion rates and average session length attributed to each campaign.
Incorporating these strategies empowers website owners to make informed decisions about their online presence. They gain a clearer understanding of how users find their site through organic search, which specific pages engage visitors most effectively, and how various marketing campaigns contribute to overall performance.
Advantages and Considerations in Using Google Analytics
Understanding the Advantages of Using Google Analytics
Google Analytics offers a multitude of advantages for businesses seeking to grow and optimize their online presence. Firstly, it provides valuable insights into website traffic, user behavior, and conversion rates. By understanding how visitors interact with a website, businesses can make data-driven decisions to enhance user experience and drive conversions. Google Analytics enables businesses to track the effectiveness of marketing campaigns, allowing them to allocate resources more efficiently based on performance metrics. This platform also offers customizable reports and real-time data tracking, empowering businesses to monitor their online performance continuously.
Considerations for Data Privacy and Compliance While Using Google Analytics
When utilizing Google Analytics, businesses must prioritize data privacy and compliance with regulations such as GDPR (General Data Protection Regulation) and CCPA (California Consumer Privacy Act). It is crucial to ensure that the collection and processing of user data align with these regulations to protect users’ privacy rights. Implementing measures such as anonymizing IP addresses, obtaining user consent for data collection through cookie banners, and regularly reviewing data retention policies are essential for maintaining compliance while leveraging the benefits of Google Analytics. Prioritizing data privacy not only fosters trust with users but also mitigates the risk of potential legal repercussions.
Exploring Alternative Analytics Platforms for Specific Business Needs
While Google Analytics is a robust tool, exploring alternative analytics platforms can be beneficial for addressing specific business needs. For instance, specialized e-commerce analytics solutions offer advanced features tailored specifically for online retailers, providing in-depth insights into product performance, sales funnels, and customer lifetime value. Moreover, some businesses may require analytics platforms that focus on app usage metrics or social media engagement data. By exploring alternative platforms tailored to specific business objectives, organizations can gain more targeted insights that align closely with their unique operational requirements.
Conclusion
You’ve now unlocked the power of Google Analytics and gained insights into visitor tracking, user behavior, and performance measurement. By harnessing the data provided by Google Analytics, you can make informed decisions to enhance your website’s effectiveness and drive growth. Remember, understanding your audience is like being a detective – the more clues you have, the better you can solve the case. So, keep exploring the reports, experimenting with different goals, and fine-tuning your strategies to optimize your online presence.
Now it’s time to put your newfound knowledge into action. Dive into your Google Analytics dashboard, start tracking those key metrics, and watch how understanding user behavior transforms your digital success. Happy analyzing!
Frequently Asked Questions
What is Google Analytics?
Google Analytics is a powerful web analytics tool that helps track and analyze website traffic, user behavior, and other crucial data to optimize online performance.
How do I set up Google Analytics?
To set up Google Analytics, create an account, obtain the tracking code, and add it to your website. Follow the step-by-step instructions provided by Google for a seamless setup process.
What are the advantages of using Google Analytics?
Google Analytics offers valuable insights into website performance, user engagement, and marketing effectiveness. It helps in making data-driven decisions to enhance online presence and achieve business goals.
How does Google Analytics track and analyze visitors?
Google Analytics uses cookies to collect data on visitor interactions with a website. It provides information on user demographics, behavior flow, acquisition channels, and more to understand audience patterns.
Why is understanding user behavior important in Google Analytics?
Understanding user behavior in Google Analytics enables businesses to tailor their strategies based on how visitors engage with their site. This insight can help improve user experience, content relevance, and conversion rates.